The Global Inflation Divide: Why 2026 Looks So Different Across Countries
The IMF projects global inflation at 4.7% in 2026. But behind that average lies a striking divide, from deflation to extreme inflation. Here's what the map reveals.
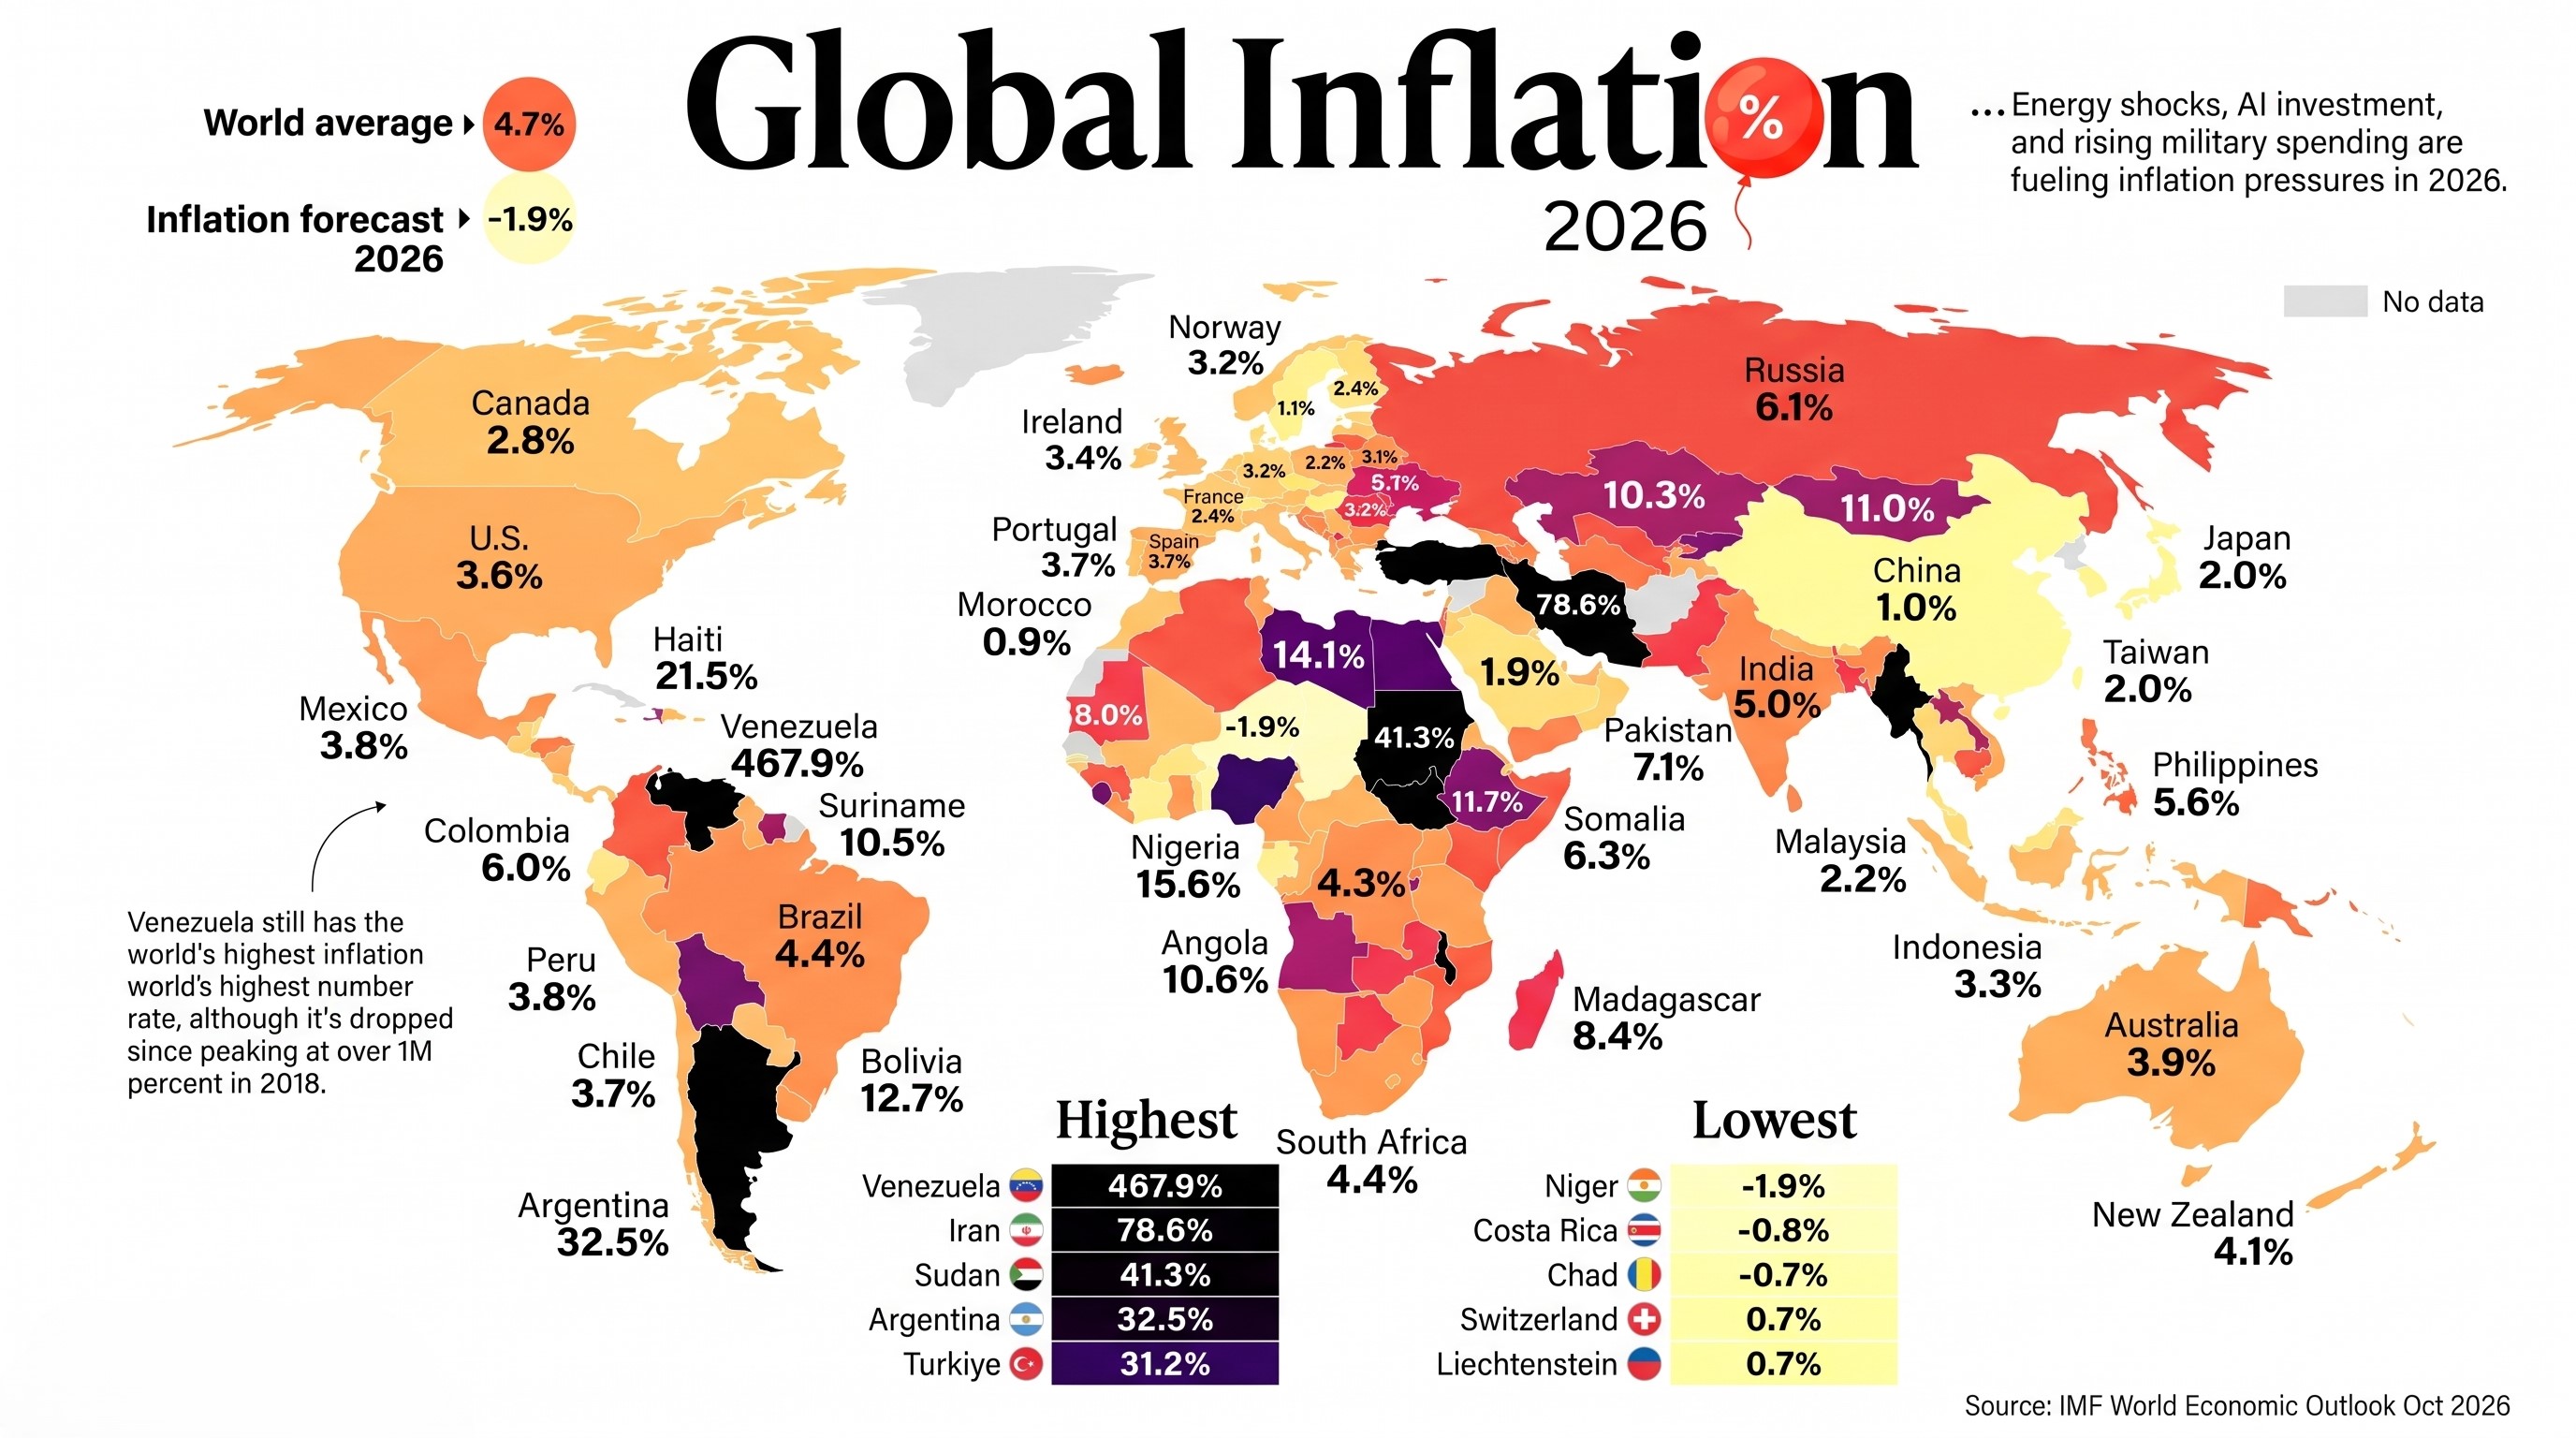
The headline number is 4.7%. The reality is far less uniform.
The International Monetary Fund projects global headline inflation to reach 4.7% in 2026, before easing to 4.1% in 2027. At first glance, that sounds like a relatively contained global average. But averages can conceal very different economic experiences.
The map accompanying this article, published by Visual Capitalist and based on the IMF’s October 2026 World Economic Outlook (WEO), compares projected inflation across 191 economies. Venezuela is at 467.9%, Iran at 78.6%, and Sudan at 41.3%. At the other end, Niger is projected to experience deflation of 1.9%.
Source: Visual Capitalist, based on the IMF World Economic Outlook, October 2026.
That is not simply a ranking of expensive and inexpensive countries. It is a snapshot of very different monetary systems, fiscal positions, exchange-rate regimes, supply conditions, and institutional resilience.
1. The global average hides a wide distribution
The IMF’s 4.7% figure is a global aggregate. It does not mean that the typical country—or the typical household—will experience inflation of 4.7%.
The country-level projections show a much wider distribution. A relatively small group of economies accounts for the most extreme readings, while most countries are projected to remain in single digits. The median country is therefore a more useful companion to the global aggregate when asking what a typical national experience looks like.
There is another important distinction: the map reports annual-average inflation projections, not a snapshot of the change in prices in one particular month. These figures compare the average consumer price level over 2026 with the average over 2025. They are forecasts, not final observed outcomes.
2. The extreme cases: Venezuela, Iran and Sudan
The ten highest projected rates in the map are:
| Economy | 2026 inflation forecast |
|---|---|
| Venezuela | 467.9% |
| Iran | 78.6% |
| Sudan | 41.3% |
| Argentina | 32.5% |
| Türkiye | 31.2% |
| South Sudan | 27.6% |
| Malawi | 21.9% |
| Haiti | 21.5% |
| Myanmar | 20.0% |
| Nigeria | 15.6% |
These economies should not be treated as one homogeneous group. Similar inflation outcomes can emerge from different combinations of domestic policy failures, currency depreciation, conflict, disrupted production, and external constraints.
Venezuela: a crisis of monetary credibility
At 467.9%, Venezuela is an extreme outlier. Hyperinflationary episodes are rarely explained by a single price shock. They are typically associated with a collapse in confidence in the domestic currency, persistent fiscal and monetary imbalances, and an inability of institutions to anchor expectations.
When people and firms no longer trust money to preserve purchasing power, they try to spend it quickly or move savings into foreign currency and other stores of value. That behavior can accelerate currency pressure and price increases.
Iran: exchange-rate pressure and persistent inflation
Iran’s projected 78.6% inflation rate places it second in the global ranking. The figure reflects a difficult macroeconomic environment in which currency weakness, external constraints, and domestic imbalances can reinforce one another.
Currency depreciation raises the local-currency cost of imported goods and production inputs. The effect does not stop at imported consumer products: machinery, components, raw materials, and transport costs can feed into domestic prices as well.
Inflation expectations matter too. When households and businesses anticipate further depreciation, they may adjust purchases, wages, and prices in advance. That can make inflation persistent even after an initial shock fades.
Sudan: supply disruption and fragility
Sudan’s 41.3% projection highlights a different mechanism. Conflict and institutional disruption can damage production, transport networks, trade, and access to essential goods. When supply contracts sharply, prices can rise even if domestic demand is weak.
This is why inflation is not always a story of excessive spending. In fragile economies, a breakdown in the ability to produce and distribute goods can be just as important.
3. Why some countries are near zero—or in deflation
At the other end of the map, Niger is projected at -1.9%, Costa Rica at -0.8%, and Chad at -0.7%.
Negative inflation means that the average price index is projected to be lower than in the previous year. But deflation is not automatically good news.
A fall in prices caused by better harvests, improved logistics, or cheaper imports can raise real purchasing power. Persistent deflation driven by weak demand is different. If consumers postpone purchases because they expect lower prices later, businesses may see weaker revenues, investment can fall, and the real burden of existing debt can rise.
The context matters. Low inflation in a stable economy is not the same thing as falling prices in an economy experiencing a contraction or a disruption in demand.
4. The exchange rate: a powerful inflation transmission channel
One of the most important links between global shocks and domestic inflation is the exchange rate.
The mechanism is straightforward:
- A currency depreciates against major trading partners.
- Imported fuel, food, machinery, and intermediate goods become more expensive in local currency.
- Firms face higher costs and pass some of them on to consumers.
- Households experience weaker purchasing power and may revise their inflation expectations.
- Demand for foreign currency can create additional pressure on the exchange rate.
The strength of this process depends on how dependent an economy is on imports, how much firms rely on imported inputs, the credibility of monetary policy, and whether households and businesses trust the domestic currency.
This helps explain why the same international shock can have very different effects across countries.
5. Energy and geopolitical shocks do not affect everyone equally
Energy prices are another major transmission channel. Oil, gas, and electricity are inputs into transportation, agriculture, manufacturing, and household consumption. A sustained increase can therefore spread across a large part of the price system.
Energy-importing economies are especially exposed when global prices rise. The pressure can be more severe when foreign-exchange reserves are limited or when public finances leave little room to support vulnerable households.
Energy exporters may receive a boost to export revenues, but that does not automatically translate into stable domestic prices. The outcome depends on fiscal institutions, domestic pricing arrangements, import dependence, and how additional revenue is managed.
The IMF’s October outlook highlights geopolitical escalation, renewed trade tensions, and fiscal vulnerabilities among the risks to the global outlook. These risks are not evenly distributed—and neither is the capacity to absorb them.
6. The policy dilemma: protect households without distorting prices
When food and energy prices rise, governments face pressure to cap prices, subsidize consumption, or provide broad relief. Some measures can help in the short term, but poorly targeted support can become expensive and create distortions.
The IMF’s October WEO argues that temporary, targeted income support is generally more cost-effective than broad measures that suppress prices. Its analysis finds that price-suppressing measures can require between three and 22 times as much fiscal resources as targeted temporary transfers.
The distinction is important. Governments can protect households most exposed to a cost-of-living shock without trying to freeze every price. Targeted transfers preserve more of the information contained in prices while directing limited public resources toward those who need them most.
That approach is easier to recommend than to implement. It requires administrative capacity, reliable household data, and fiscal space—precisely the resources that may be scarce in the most fragile economies.
7. What this map cannot tell us
The map is useful, but it is not a complete measure of economic well-being.
- Inflation is not the price level. A country with 2% inflation may still be much more expensive than one with 10% inflation.
- National averages hide household differences. Lower-income households often spend a larger share of their income on food, energy, and other necessities, so their personal inflation experience can be higher than the headline rate.
- Annual averages differ from end-of-period rates. The two measures answer different questions and should not be compared as if they were identical.
- Forecasts are not outcomes. The IMF’s October projections are based on information available through October 1, 2026. New developments can change the outlook.
The figures should therefore be read as a forecast snapshot, not as a final verdict on each economy.
Conclusion: one global economy, very different inflation realities
The most important message in the 2026 inflation map is not simply that global inflation is projected at 4.7%. It is that the global average conceals a deeply uneven landscape.
Some economies have relatively contained price pressures. Others face a combination of currency instability, fiscal constraints, conflict, supply disruption, and weak monetary credibility. These differences shape not only the inflation rate, but also how much damage a shock does to household purchasing power and long-term economic confidence.
The IMF projects global inflation to ease to 4.1% in 2027. But a lower global average does not guarantee that the countries currently facing the most severe inflation will recover at the same pace.
A global average can describe the direction of the world economy. It cannot describe the experience of every person living in it.
Sources and notes
- International Monetary Fund. (2026). World Economic Outlook, October 2026: Resilience Under Strain, Urgent Choices. https://www.imf.org/en/Publications/WEO/Issues/2026/10/13/world-economic-outlook-october-2026
- International Monetary Fund. (2026). World Economic Outlook Database, October 2026. https://data.imf.org/datasets/WEO
- Neufeld, D. (2026, October 30). Mapped: Inflation Rates Around the World in 2026. Visual Capitalist. https://www.visualcapitalist.com/mapped-inflation-rates-around-the-world-in-2026/
Data note: Country-level figures shown in the map are 2026 annual-average inflation projections based on the IMF’s October 2026 WEO dataset. The map was created by Visual Capitalist; it was not itself published by the IMF.