Bitcoin: Two Scenarios for the Next 2–3 Weeks
Bitcoin is caught between bullish daily structure and a strong bearish 4H trend. A scenario-based look at the key levels, triggers, invalidation points, and risk.
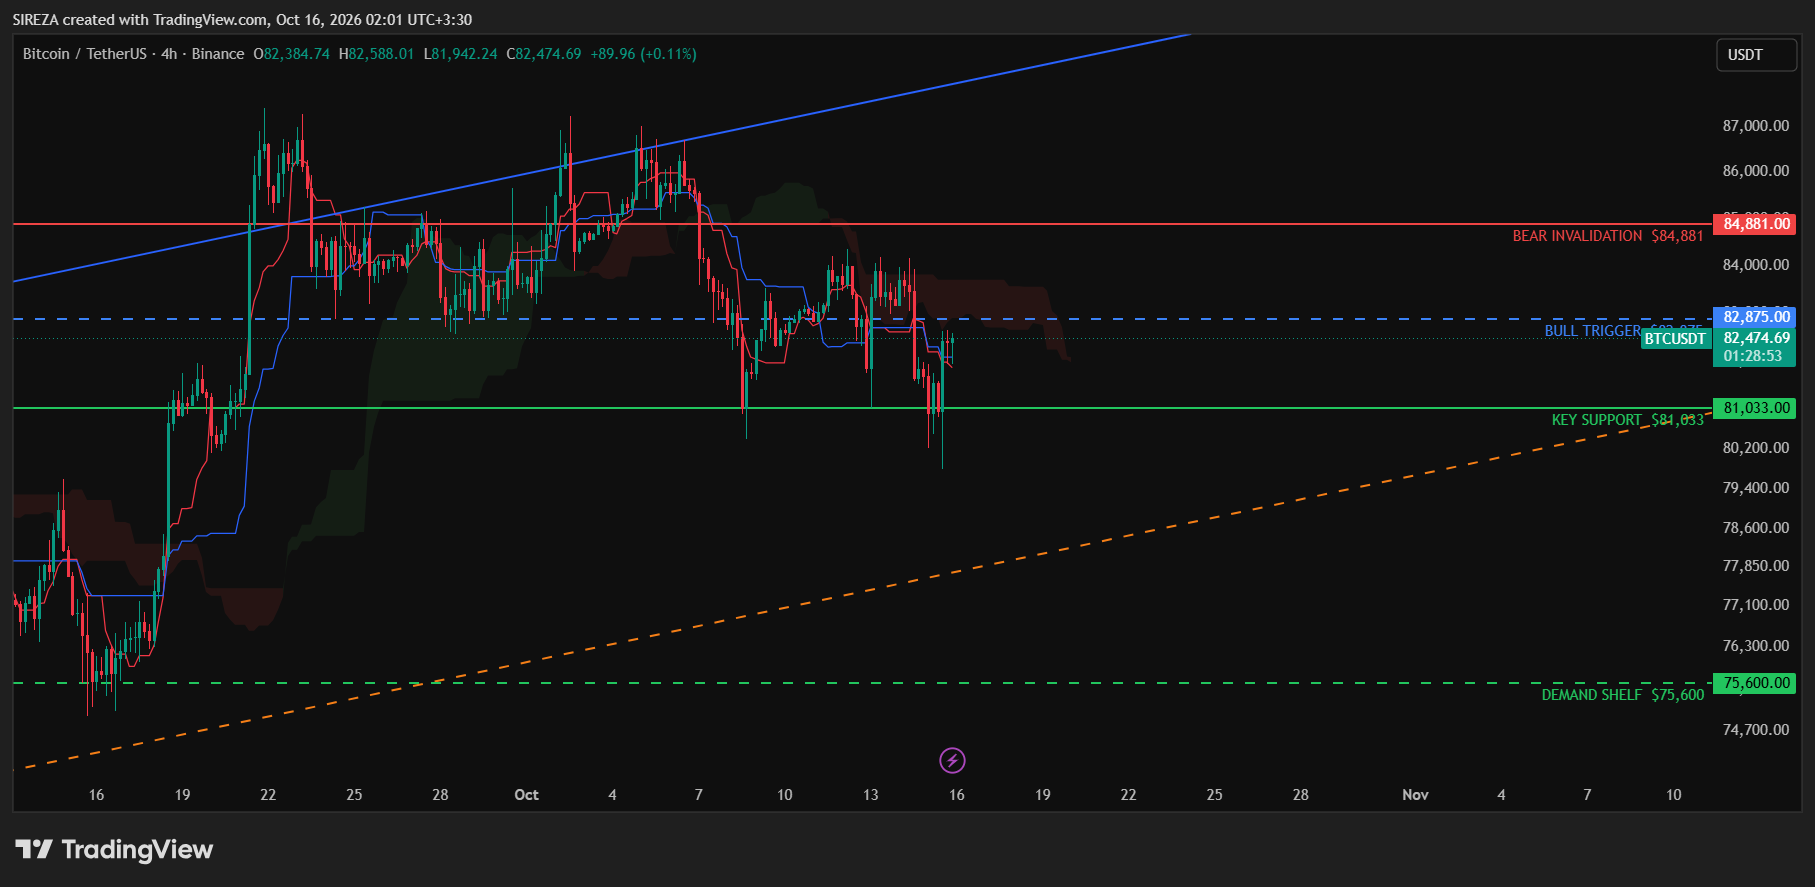
Market snapshot: BTC at $82,413. The price and technical levels below are from the supplied analysis and are not a live quote.
Bitcoin is sitting in a genuine multi-timeframe conflict. The daily structure remains bullish, but the 4-hour chart is in a strong bearish trend. That conflict—not a confident prediction in either direction—is the key point.
The current structure
- Daily: Bullish structure, with a bullish change of character (CHoCH) at $66,956.
- Weekly: Rating of Buy.
- 4-hour: Bearish structure, with a bearish CHoCH at $82,563, followed by a bearish break of structure (BOS) at $81,033.
- 4-hour ADX: 36.5, consistent with a strong trend.
- Location: Price is in the premium zone on both timeframes and sits approximately 5.7% below the structural high at $87,395.
Across the timeframes counted in this setup, two are bullish, one is bearish, and none are neutral. But timeframe count alone does not settle the question: the 4-hour chart is the dominant execution timeframe here, and its trend is strongly bearish.
Scenario 1: Bullish continuation
Trigger: A 4-hour candle closes above $82,875, supported by above-average volume.
If buyers reclaim that level with convincing participation, the potential path is:
$83,146 → $84,168 → $84,463 → $84,881 → $85,347
The $84,168 area contains an unmitigated bearish order block, making it a zone to watch rather than a level to assume price will pass through easily.
Invalidation: A 4-hour close below $81,033.
Main risk: A break through the order block without meaningful volume could be a false breakout. Price moving above a level is not enough on its own; participation matters.
Scenario 2: Bearish continuation
This is currently the dominant scenario.
Trigger: A 4-hour candle closes below $81,033, which aligns with the swing low and the daily Fibonacci 0.5 level.
If that breakdown confirms, the potential path is:
$79,715 → $78,490–$80,555 → $75,600
The $79,715 level corresponds to the daily Fibonacci 0.618 level. The $78,490–$80,555 area is an unfilled 4-hour fair value gap (FVG).
Invalidation: A 4-hour close above $84,881.
Main risk: Two unmitigated bearish order blocks sit overhead. They may act as resistance, but they do not guarantee a decline; a strong reclaim of key levels would weaken the bearish case.
The levels that matter
For now, the decision is concentrated around two boundaries:
- $81,033: A 4-hour close below it would strengthen the bearish continuation case.
- $84,881: A move above it, confirmed by a 4-hour close, would invalidate the current bearish scenario under this framework.
Between these levels, price action may be noisy and direction can remain unclear. That does not mean every move inside the range is meaningless; it means the setup does not yet offer a clear directional confirmation.
What this analysis does—and does not—say
The honest read is mixed, with a bearish tilt. Confidence is low. Neither of the structural tools used for this analysis returned a setup above the minimum 2:1 risk-to-reward ratio at the quoted price.
So these scenarios are roadmaps, not entry signals. A trigger is only one part of a trade plan; position size, invalidation, execution costs, and the actual risk-to-reward at entry still matter.
Educational content only; not financial advice. Crypto markets are volatile. Always size positions according to your own risk tolerance and never treat a scenario as a guaranteed outcome.